INSIDE A
Everyday life fills a home with pollutants you can’t see. Follow them from the source, room to room, and out.
Illustrative model · not measured data
Scenario
Layers
Whole home
HOW IT WORKS
The room-by-room sources follow Figure 1 (p.189) of the Chief Medical Officer’s annual report 2022: air pollution, adapted from the Royal College of Physicians (2016). Most advice in the “Try a change” cards comes from its recommendations for the public (p.251–252). Page numbers are the report’s printed page numbers.
Opening windows dilutes indoor pollution, but it also loses heat, lets in cold air, noise and outdoor pollution, and is less practical in winter (p.199, 205). The report suggests keeping trickle vents open, using extractor fans, closing road-facing windows for short periods when outdoor pollution is high, and using high-level openings in winter. Making homes more airtight without improving ventilation can raise indoor pollutants, including radon (p.29, 206).
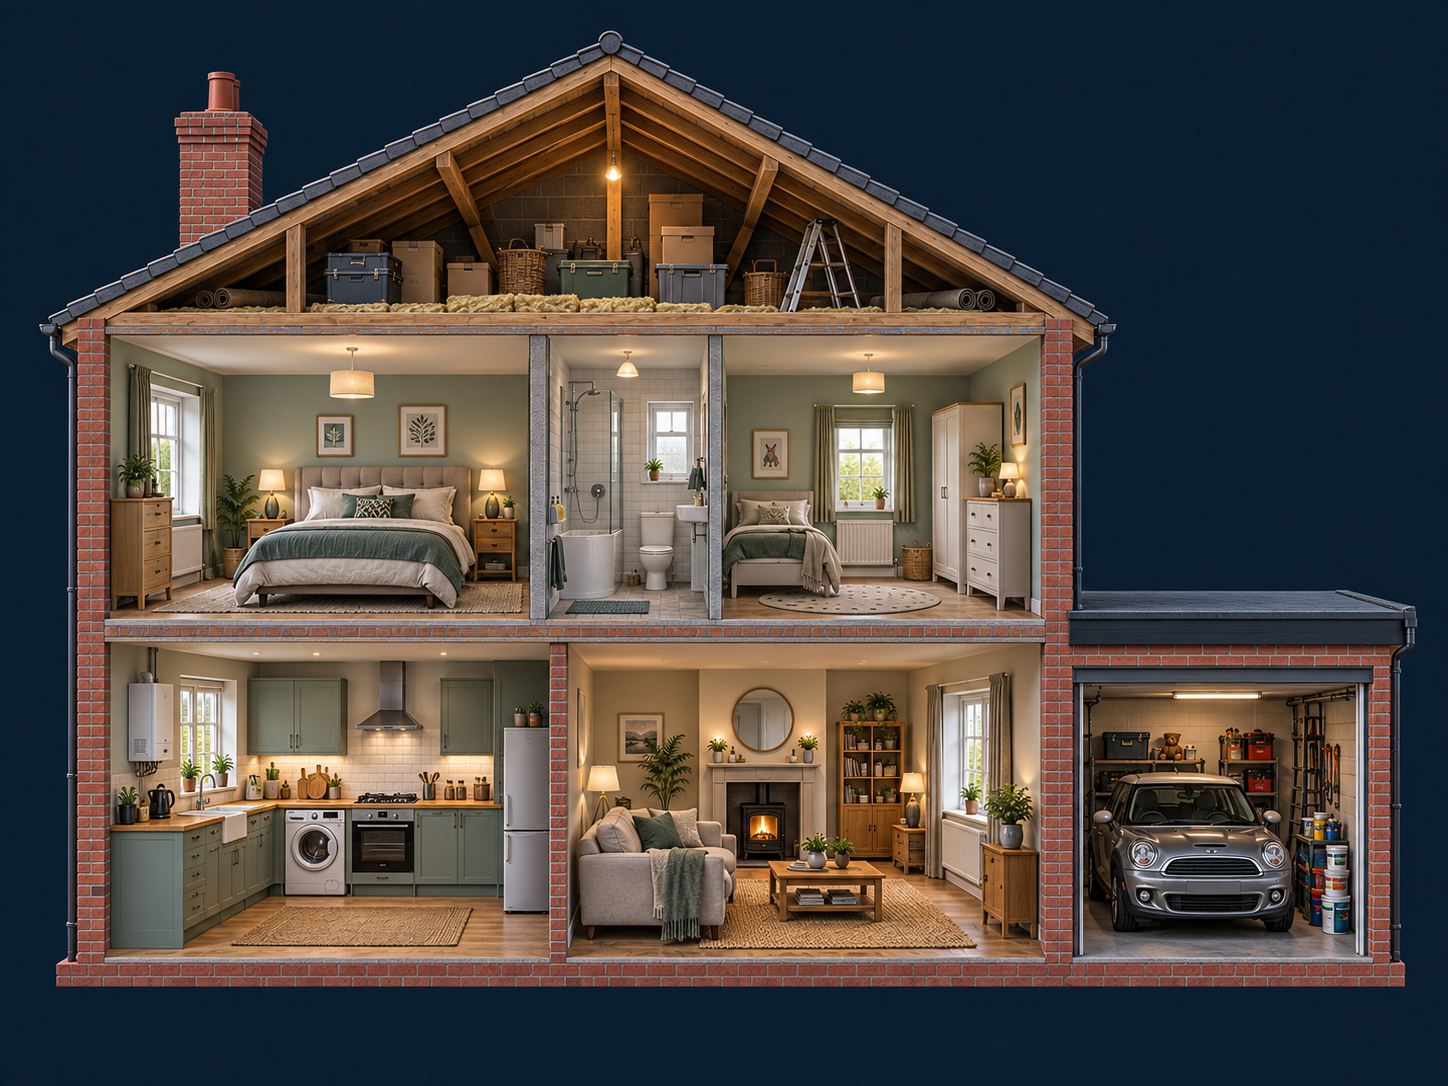
The house follows a typical British layout: a loft, two bedrooms around a central bathroom upstairs, a kitchen and living room downstairs, and an attached garage. There is no basement. It is illustrative, not a survey of a real property.
Coloured particles represent categories of pollutant. Their size, number and movement are illustrative. The air-load numbers come from a simple teaching model of sources, air exchange and room-to-room mixing. They are not concentrations, measurements or health assessments. Many gases can’t be seen or smelled.
The room layout was planned from the report’s Figure 1 and an illustrated cutaway of the same house.
THE AIR INSIDE
Figures from the Chief Medical Officer’s annual report 2022: air pollution.
Your browser couldn’t start WebGL, so here is an illustrated cutaway of the house instead.